在现代软件开发中,实时监控系统资源使用情况是一个重大需求。无论是开发过程中的性能调试,还是生产环境中的系统监控,一个直观、高效的监控界面都能提供巨大协助。本文将介绍如何使用 Python 的 PyQtGraph 库创建一个高性能的实时系统监控工具。
一、技术栈选择
PyQtGraph 的优势
PyQtGraph 是一个基于 PyQt/PySide 和 NumPy 的图形和用户界面库,特别适合科学计算和工程应用。相比于 Matplotlib,PyQtGraph 在实时数据可视化方面具有显著优势:
- 高性能渲染:专为实时数据更新优化
- 丰富的交互功能:支持缩放、平移、数据选择等
- 简洁的 API:几行代码即可创建复杂的可视化界面
- Qt 集成:完美融入 PyQt/PySide 应用程序
核心依赖
import sys
import time
import psutil
import platform
from collections import deque
from PyQt5 import QtCore
from PyQt5.QtWidgets import (QApplication, QMainWindow, QWidget, QVBoxLayout,
                            QHBoxLayout, QLabel, QSizePolicy)
from PyQt5.QtCore import Qt, QTimer, QThread, pyqtSignal
from PyQt5.QtGui import QColor, QFont
from qfluentwidgets import (CardWidget, setTheme, Theme, FluentIcon, TitleLabel,
                            BodyLabel, ProgressBar, setFont, SmoothScrollArea)
from pyqtgraph import PlotWidget, mkPen
import pyqtgraph as pg
二、架构设计
多线程数据采集
为了避免阻塞 UI 线程,我们使用独立的 QThread 进行数据采集:
class DataCollector(QThread):
    """数据采集线程,避免阻塞UI"""
    data_updated = pyqtSignal(float, float, float, float, str, str, str, str, int, int)

    def __init__(self, parent=None):
        super().__init__(parent)
        self.running = True
        self.last_net_io = psutil.net_io_counters()
        self.start_time = time.time()


    def run(self):
        while self.running:
            try:
                # 获取系统数据
                cpu_percent = psutil.cpu_percent(interval=0.1)
                memory = psutil.virtual_memory()
                memory_percent = memory.percent

                try:
                    disk = psutil.disk_usage('/')
                    disk_percent = disk.percent
                except:
                    disk_percent = 0

                net_io = psutil.net_io_counters()
                byte_diff = (net_io.bytes_sent + net_io.bytes_recv) - (self.last_net_io.bytes_sent + self.last_net_io.bytes_recv)
                self.last_net_io = net_io

                max_bandwidth = 12.5 * 1024 * 1024  # 12.5 MB/s
                net_usage = min(100, byte_diff / max_bandwidth * 100)

                # 获取系统信息
                physical_cores = psutil.cpu_count(logical=False) or 1
                logical_cores = psutil.cpu_count(logical=True) or 1
                cpu_freq = psutil.cpu_freq()
                cpu_info = f"{physical_cores}核{logical_cores}线程"
                if cpu_freq:
                    cpu_info += f" ({cpu_freq.max/1000:.1f}GHz)"

                memory_info = f"{memory.total/(1024**3):.1f} GB"
                system_info = f"{platform.system()} {platform.architecture()[0]}"

                uptime_seconds = time.time() - self.start_time
                days = int(uptime_seconds // 86400)
                hours = int((uptime_seconds % 86400) // 3600)
                uptime_info = f"{days}天 {hours}小时"

                processes = len(psutil.pids())

                # 计算线程数(每5次更新一次)
                if int(uptime_seconds) % 5 == 0:
                    threads = sum(p.num_threads() for p in psutil.process_iter(['num_threads']))
                else:
                    threads = 0

                # 发送数据信号
                self.data_updated.emit(
                    cpu_percent, memory_percent, disk_percent, max(0, net_usage),
                    cpu_info, memory_info, system_info, uptime_info,
                    processes, threads
                )

            except Exception as e:
                print(f"数据采集错误: {e}")

            time.sleep(1)  # 每秒采集一次


    def stop(self):
        self.running = False
        self.wait()
响应式 UI 设计
主窗口类负责创建和管理所有 UI 组件:
class SystemMonitorWindow(QMainWindow):
    def __init__(self):
        super().__init__()
        self.setWindowTitle("系统资源监视器")
        self.resize(900, 600)

        # 初始化数据队列
        self.max_points = 60  # 减少数据点数量提高性能
        self.cpu_data = deque([0] * self.max_points, maxlen=self.max_points)
        self.memory_data = deque([0] * self.max_points, maxlen=self.max_points)
        self.disk_data = deque([0] * self.max_points, maxlen=self.max_points)
        self.network_data = deque([0] * self.max_points, maxlen=self.max_points)

        # 设置Fluent Design主题
        setTheme(Theme.LIGHT)

        # 创建中央部件
        central_widget = SmoothScrollArea()
        central_widget.setWidgetResizable(True)
        self.setCentralWidget(central_widget)

        content_widget = QWidget()
        central_widget.setWidget(content_widget)
        main_layout = QVBoxLayout(content_widget)
        main_layout.setContentsMargins(20, 20, 20, 20)
        main_layout.setSpacing(20)

        # 标题
        title_label = TitleLabel("性能监视器")
        title_label.setAlignment(Qt.AlignCenter)
        title_label.setStyleSheet("color: #000000; font-size: 24px;")
        main_layout.addWidget(title_label)

        # 创建顶部布局(CPU和内存使用率)
        top_layout = QHBoxLayout()
        top_layout.setSpacing(20)

        # CPU使用率卡片
        cpu_card = self.create_card("CPU 使用率", FluentIcon.SPEED_MEDIUM, "#4FC3F7")
        self.cpu_progress = cpu_card.findChild(ProgressBar)
        self.cpu_graph = self.create_plot_widget("CPU 使用率", "#4FC3F7")
        cpu_card.layout().addWidget(self.cpu_progress)
        cpu_card.layout().addWidget(self.cpu_graph)

        # 内存使用率卡片
        memory_card = self.create_card("内存使用率", FluentIcon.IOT, "#81C784")
        self.memory_progress = memory_card.findChild(ProgressBar)
        self.memory_graph = self.create_plot_widget("内存使用率", "#81C784")
        memory_card.layout().addWidget(self.memory_progress)
        memory_card.layout().addWidget(self.memory_graph)

        top_layout.addWidget(cpu_card)
        top_layout.addWidget(memory_card)
        main_layout.addLayout(top_layout)

        # 创建底部布局(磁盘和网络)
        bottom_layout = QHBoxLayout()
        bottom_layout.setSpacing(20)

        # 磁盘使用率卡片
        disk_card = self.create_card("磁盘使用率", FluentIcon.SAVE_AS, "#FFB74D")
        self.disk_progress = disk_card.findChild(ProgressBar)
        self.disk_graph = self.create_plot_widget("磁盘使用率", "#FFB74D")
        disk_card.layout().addWidget(self.disk_progress)
        disk_card.layout().addWidget(self.disk_graph)

        # 网络使用率卡片
        network_card = self.create_card("网络使用率", FluentIcon.WIFI, "#BA68C8")
        self.network_progress = network_card.findChild(ProgressBar)
        self.network_graph = self.create_plot_widget("网络使用率", "#BA68C8")
        network_card.layout().addWidget(self.network_progress)
        network_card.layout().addWidget(self.network_graph)

        bottom_layout.addWidget(disk_card)
        bottom_layout.addWidget(network_card)
        main_layout.addLayout(bottom_layout)

        # 创建系统信息卡片
        info_card = CardWidget()
        info_layout = QVBoxLayout(info_card)
        info_layout.setContentsMargins(20, 20, 20, 20)

        info_title = BodyLabel("系统信息")
        info_title.setStyleSheet("font-size: 16px; font-weight: bold; color: #000000;")
        info_layout.addWidget(info_title)

        # 系统信息行
        self.info_labels = {}
        info_layout.addLayout(self.create_info_row("处理器:", "cpu_info"))
        info_layout.addLayout(self.create_info_row("已安装内存:", "memory_info"))
        info_layout.addLayout(self.create_info_row("系统类型:", "system_info"))
        info_layout.addLayout(self.create_info_row("正常运行时间:", "uptime_info"))
        info_layout.addLayout(self.create_info_row("进程数:", "processes_info"))
        info_layout.addLayout(self.create_info_row("线程数:", "threads_info"))

        main_layout.addWidget(info_card)

        # 创建数据采集线程
        self.data_collector = DataCollector()
        self.data_collector.data_updated.connect(self.update_ui)
        self.data_collector.start()

        # 设置字体
        self.setFont(QFont("Segoe UI", 10))
三、关键功能实现
1. 实时曲线图绘制
使用 PyQtGraph 的 PlotWidget 创建高性能曲线图:
def create_plot_widget(self, title, color):
        """创建优化的绘图部件"""
        graph = PlotWidget()
        graph.setBackground('transparent')
        graph.setSizePolicy(QSizePolicy.Expanding, QSizePolicy.Expanding)
        graph.setMaximumHeight(500)
        graph.setTitle(title, color='#CCCCCC', size='10pt')
        graph.setLabel('left', '使用率 (%)', color='#AAAAAA')
        graph.setLabel('bottom', '时间 (秒)', color='#AAAAAA')
        graph.showGrid(x=True, y=True, alpha=0.5)
        graph.setYRange(0, 100)
        graph.setXRange(0, self.max_points-1, padding=0)
        # 隐藏自动缩放按钮
        graph.hideButtons()
        # 设置鼠标交互模式
        graph.getPlotItem().setMouseEnabled(x=False, y=False)
        graph.getPlotItem().getViewBox().setMenuEnabled(False)
        # 开启抗锯齿
        graph.setAntialiasing(True)

        # 创建曲线
        curve = graph.plot(pen=mkPen(color, width=2), fillLevel=0, brush=color+'20')

        # 添加当前值标签
        label = pg.TextItem(text="0%", anchor=(1, 1), color=color)
        label.setPos(self.max_points-1, 100-20)
        graph.addItem(label)

        # 存储曲线对象和标签
        graph.curve = curve
        graph.label = label
        graph.color = color

        return graph
2. 数据卡片组件
创建统一风格的监控卡片:
def create_card(self, title, icon, color):
        """创建卡片组件"""
        card = CardWidget()
        layout = QVBoxLayout(card)
        layout.setContentsMargins(20, 20, 20, 20)

        header = QHBoxLayout()
        icon_label = QLabel()
        icon_label.setPixmap(icon.icon().pixmap(24, 24))
        icon_label.setStyleSheet("background-color: transparent;")

        title_label = BodyLabel(title)
        title_label.setStyleSheet(f"font-size: 16px; font-weight: bold; color: {color};")

        header.addWidget(icon_label)
        header.addWidget(title_label)
        header.addStretch()

        progress = ProgressBar()
        progress.setRange(0, 100)
        progress.setStyleSheet(f"""
            QProgressBar {{
                border: 1px solid #444;
                border-radius: 7px;
                text-align: center;
                background: #333;
            }}
            QProgressBar::chunk {{
                background: {color};
                border-radius: 7px;
            }}
        """)

        layout.addLayout(header)
        layout.addWidget(progress)
        card.progress = progress  # 保存引用
        return card

def create_info_row(self, key, attr_name):
        """创建系统信息行"""
        row_layout = QHBoxLayout()

        key_label = BodyLabel(key)
        key_label.setStyleSheet("color: #000000; min-width: 100px;")
        row_layout.addWidget(key_label)

        value_label = BodyLabel("正在获取...")
        value_label.setStyleSheet("color: #000000;")
        row_layout.addWidget(value_label)
        row_layout.addStretch()

        self.info_labels[attr_name] = value_label
        return row_layout
3. 实时数据更新
通过信号槽机制实现线程安全的 UI 更新:
def update_ui(self, cpu, memory, disk, network, cpu_info, mem_info, sys_info, uptime, procs, threads):
        """更新UI界面"""
        # 更新数据队列
        self.cpu_data.append(cpu)
        self.memory_data.append(memory)
        self.disk_data.append(disk)
        self.network_data.append(network)

        # 更新进度条
        self.cpu_progress.setValue(int(cpu))
        self.memory_progress.setValue(int(memory))
        self.disk_progress.setValue(int(disk))
        self.network_progress.setValue(int(network))

        # 更新曲线图
        self.update_plot(self.cpu_graph, list(self.cpu_data), cpu)
        self.update_plot(self.memory_graph, list(self.memory_data), memory)
        self.update_plot(self.disk_graph, list(self.disk_data), disk)
        self.update_plot(self.network_graph, list(self.network_data), network)

        # 更新系统信息(仅当有新值时更新)
        self.info_labels["cpu_info"].setText(cpu_info)
        self.info_labels["memory_info"].setText(mem_info)
        self.info_labels["system_info"].setText(sys_info)
        self.info_labels["uptime_info"].setText(uptime)
        self.info_labels["processes_info"].setText(str(procs))
        if threads > 0:  # 仅当有新线程数据时更新
            self.info_labels["threads_info"].setText(str(threads))

    def update_plot(self, graph, data, current_value):
        """更新曲线图"""
        graph.curve.setData(data)
        graph.label.setText(f"{current_value:.0f}%")  # 显示整数百分比
        graph.label.setColor(graph.color)

        # 自动滚动视图
        #graph.setXRange(max(0, len(data)-self.max_points), len(data)-1)


    def closeEvent(self, event):
        """关闭窗口时停止线程"""
        self.data_collector.stop()
        super().closeEvent(event)
4. 主函数
实例化SystemMonitorWindow类运行监控:
if __name__ == "__main__":
    # 启用高DPI缩放,设置支持高分辨率屏幕自适应
    QApplication.setHighDpiScaleFactorRoundingPolicy(
        QtCore.Qt.HighDpiScaleFactorRoundingPolicy.PassThrough
    )
    QtCore.QCoreApplication.setAttribute(QtCore.Qt.AA_EnableHighDpiScaling)
    QtCore.QCoreApplication.setAttribute(QtCore.Qt.AA_UseHighDpiPixmaps)
    app = QApplication(sys.argv)
    app.setStyle("Fusion")

    window = SystemMonitorWindow()
    window.show()
    sys.exit(app.exec_())
四、性能优化技巧
1. 数据队列限制
self.max_points = 60  # 限制数据点数量,提高渲染性能
self.cpu_data = deque([0] * self.max_points, maxlen=self.max_points)
2. 抗锯齿控制
graph.setAntialiasing(True) # 根据需要开启/关闭抗锯齿3. 鼠标交互优化
# 禁用不必要的鼠标交互
graph.getPlotItem().setMouseEnabled(x=False, y=False)
graph.getPlotItem().getViewBox().setMenuEnabled(False)
graph.hideButtons()  # 隐藏自动缩放按钮
五、实际应用效果
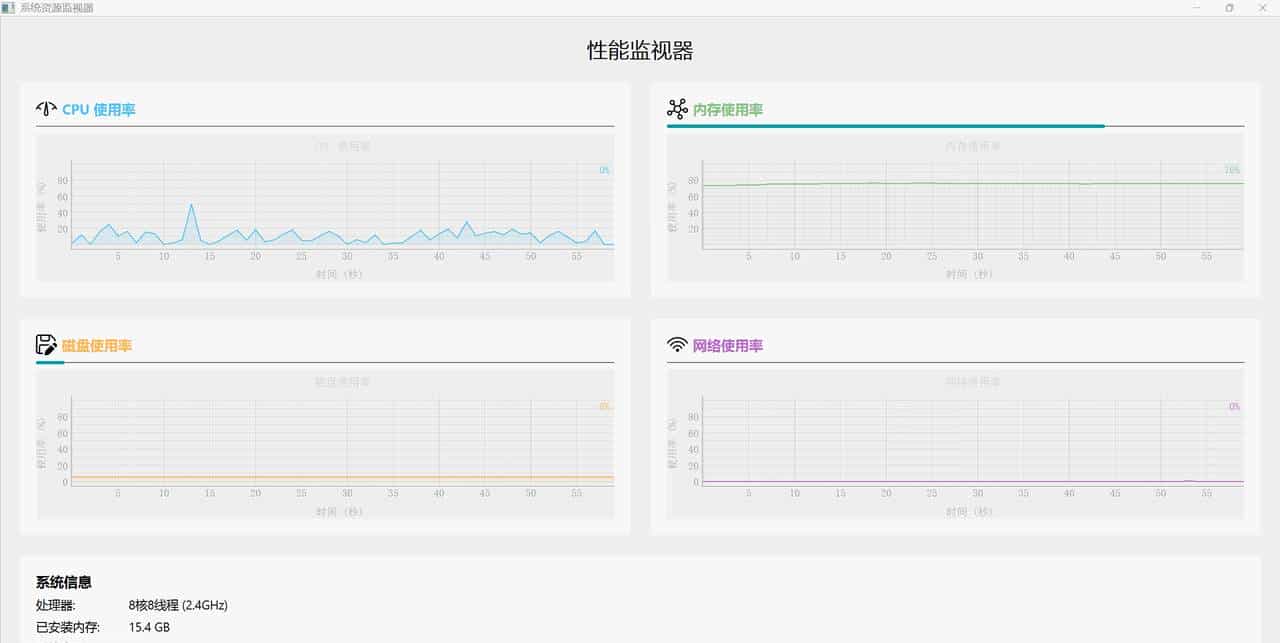
程序运行效果图
这个系统监控工具具有以下特点:
- 实时性:每秒更新一次数据,流畅无卡顿
- 多功能:监控 CPU、内存、磁盘、网络四大核心指标
- 美观性:采用 Fluent Design 设计语言,现代简洁
- 低资源占用:优化后的代码对系统资源影响极小
- 跨平台:支持 Windows、Linux、macOS 系统
六、总结
PyQtGraph 为 Python 开发者提供了一个强劲而灵活的实时数据可视化解决方案。通过合理的架构设计和性能优化,我们可以创建出既美观又高效的系统监控工具。这种技术组合特别适合需要实时数据展示的科学计算、工程监控和数据分析应用。
© 版权声明
文章版权归作者所有,未经允许请勿转载。
相关文章


暂无评论...