
配置
一、PHPstudy 配置
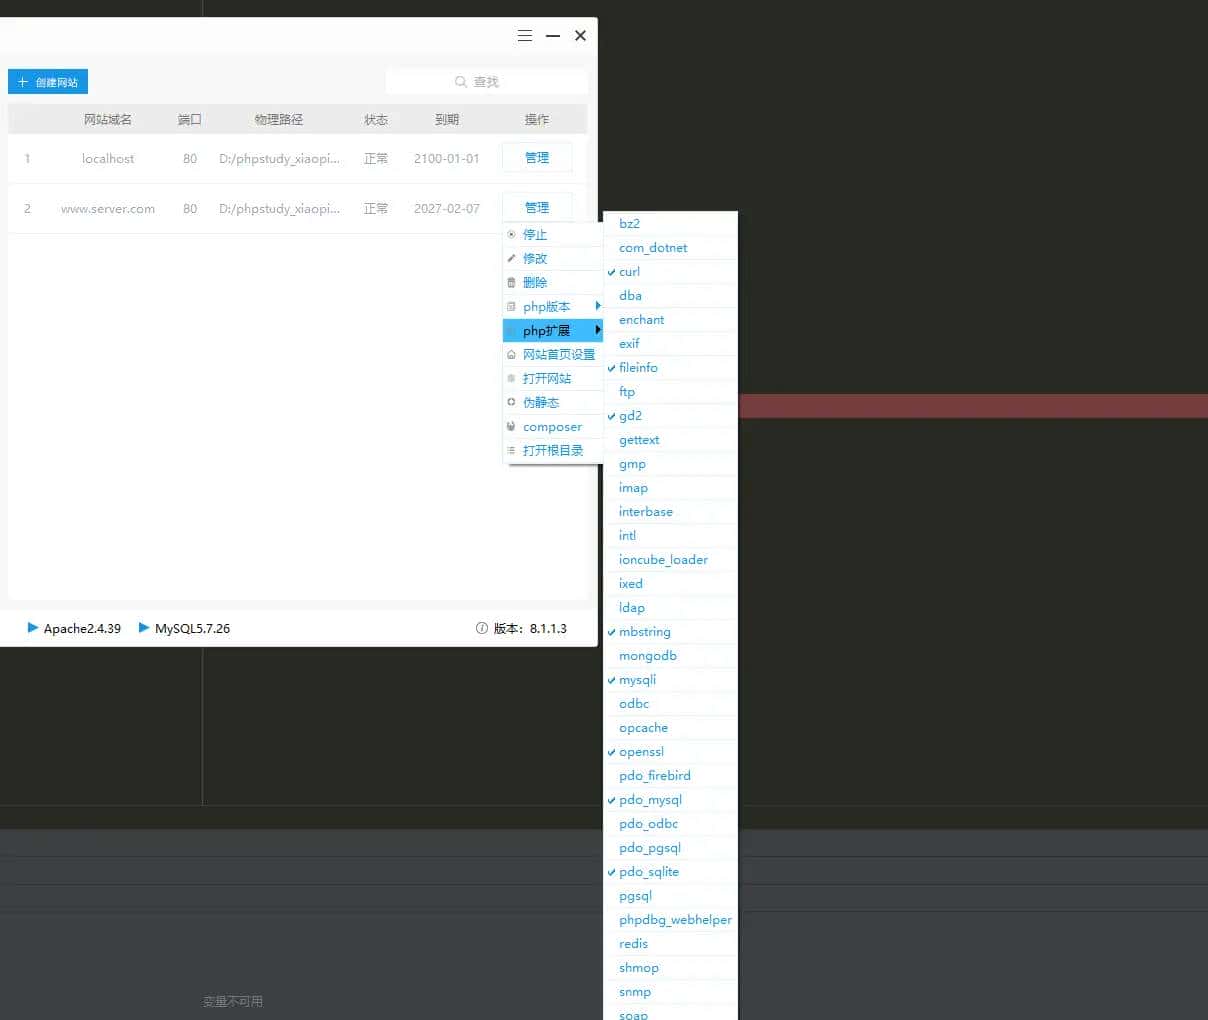
1.打开 phpstudy 中的 xdebug 扩展
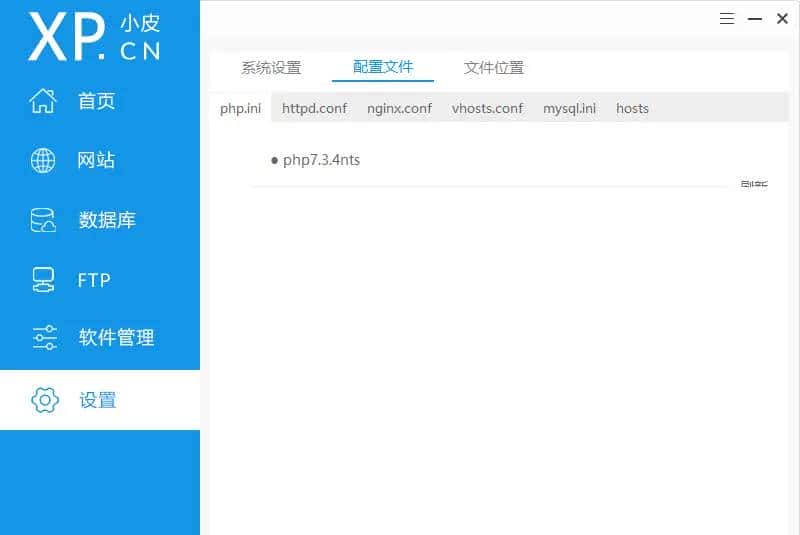
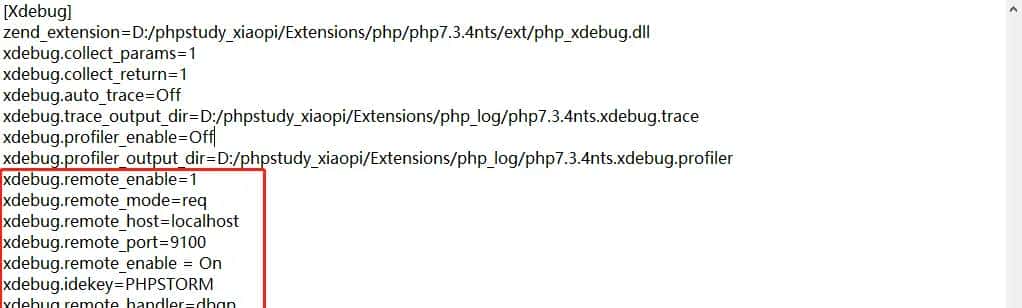
2.修改对应php版本的 php.ini 文件,我用的版本是 7.3.4
二、Phpstorm 配置
注意每次配置不要忘记点击右下角
APPLY(应用),以保存配置
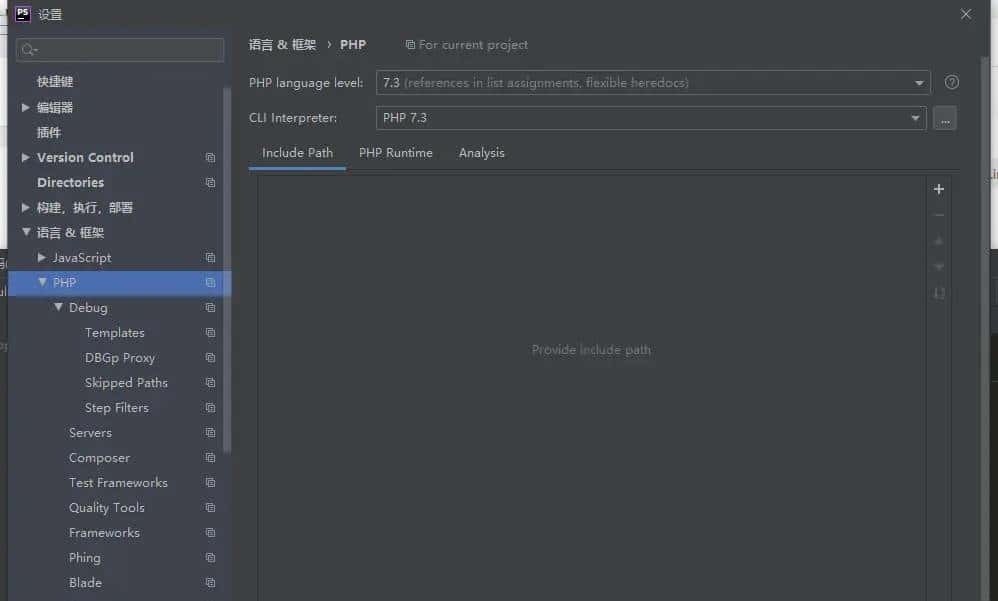
1.Phpstorm中 setting->Languages and Frameworks->PHP 选择对应PHP版本的PHP language level与CLI Interpreter
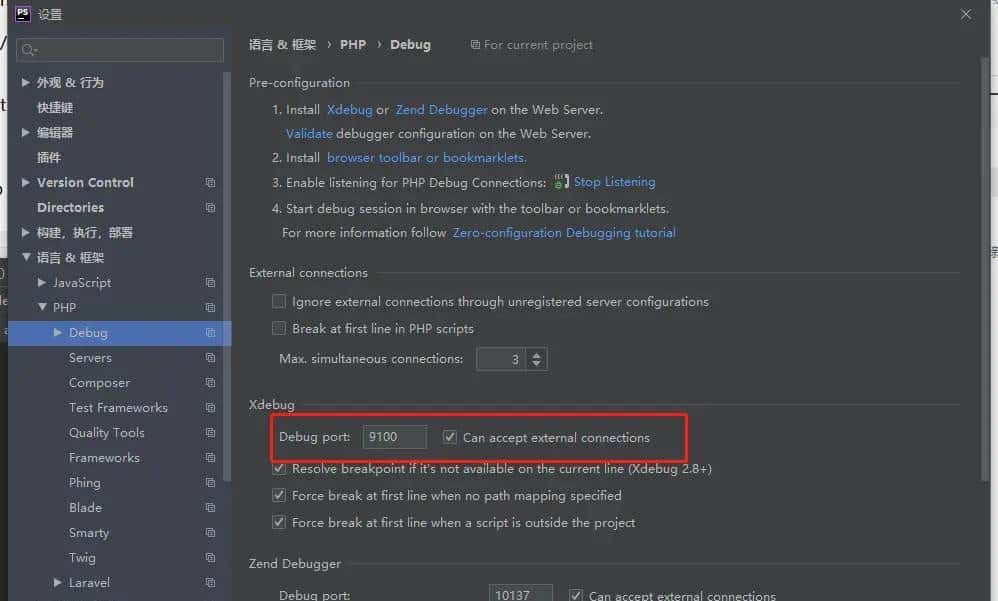
2.Phpstorm中 setting->Languages and Frameworks->PHP->Debug 配置
Debug port设置为 php.ini 里面设置的端口
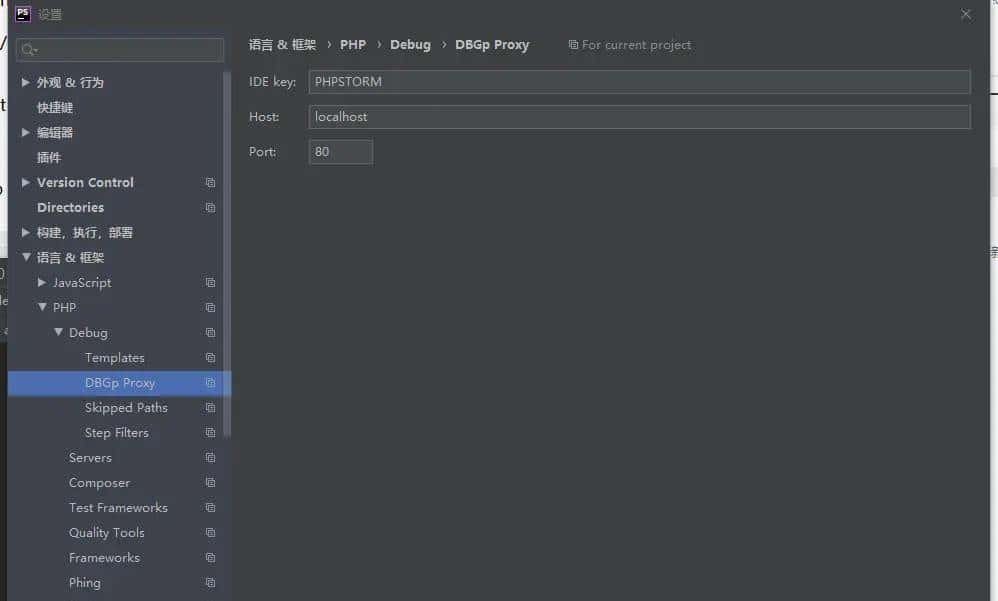
3.Phpstorm中 setting->Languages and Frameworks->PHP->Debug->DBGp Proxy 配置
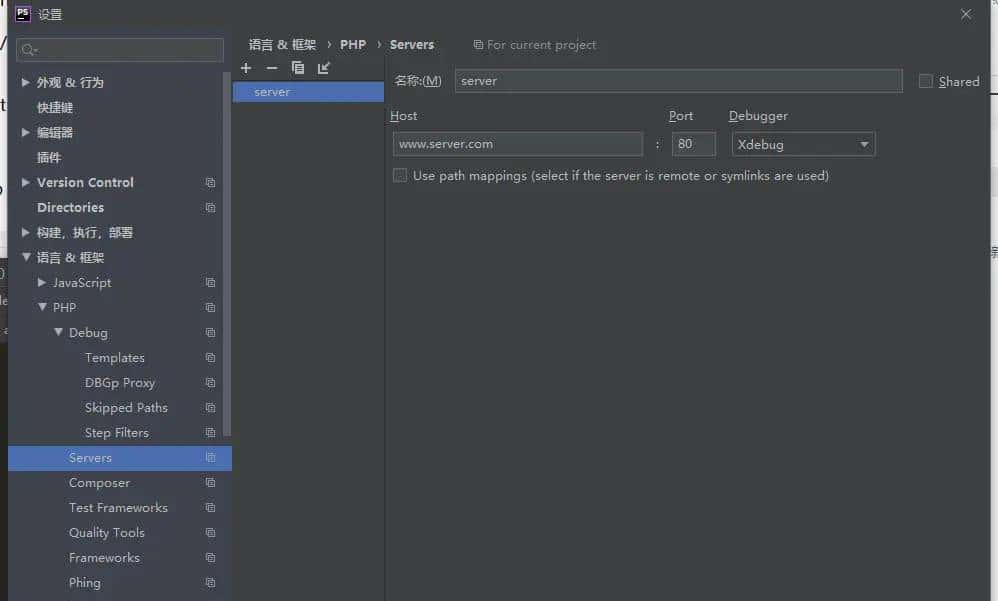
4.Phpstorm中 setting->Languages and Frameworks->PHP->Servers 配置
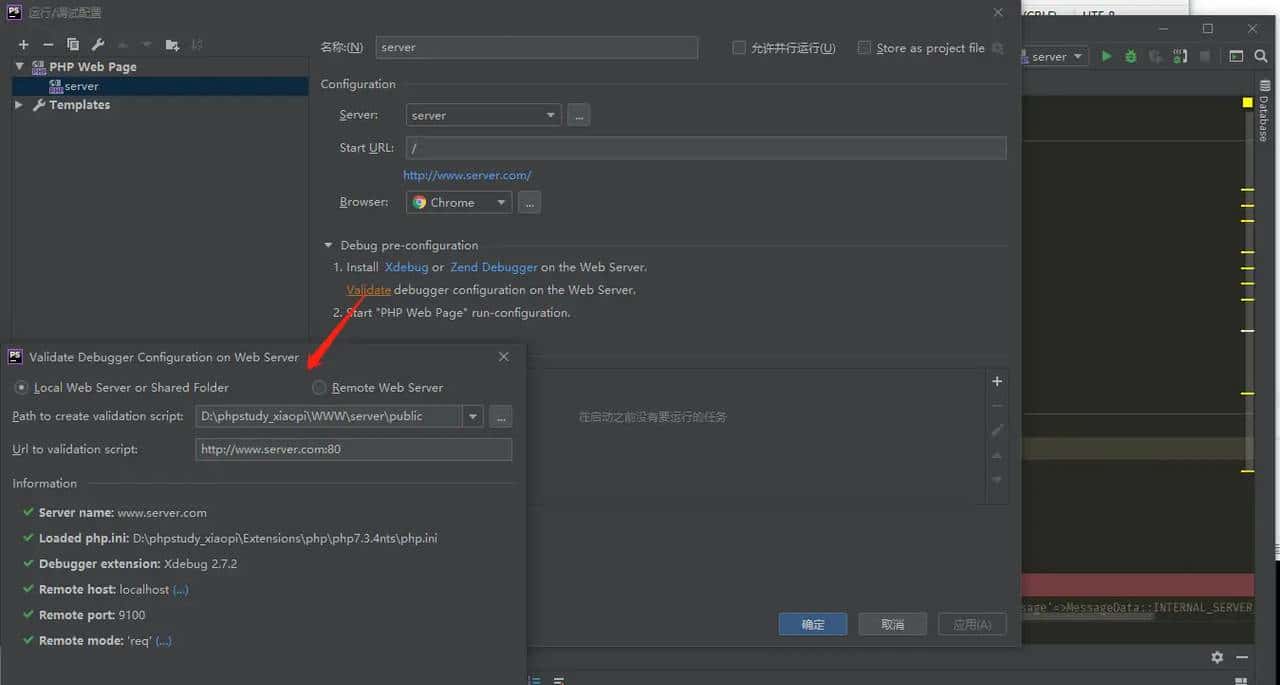
5.头部导航处 Run->Edit Configurations 配置
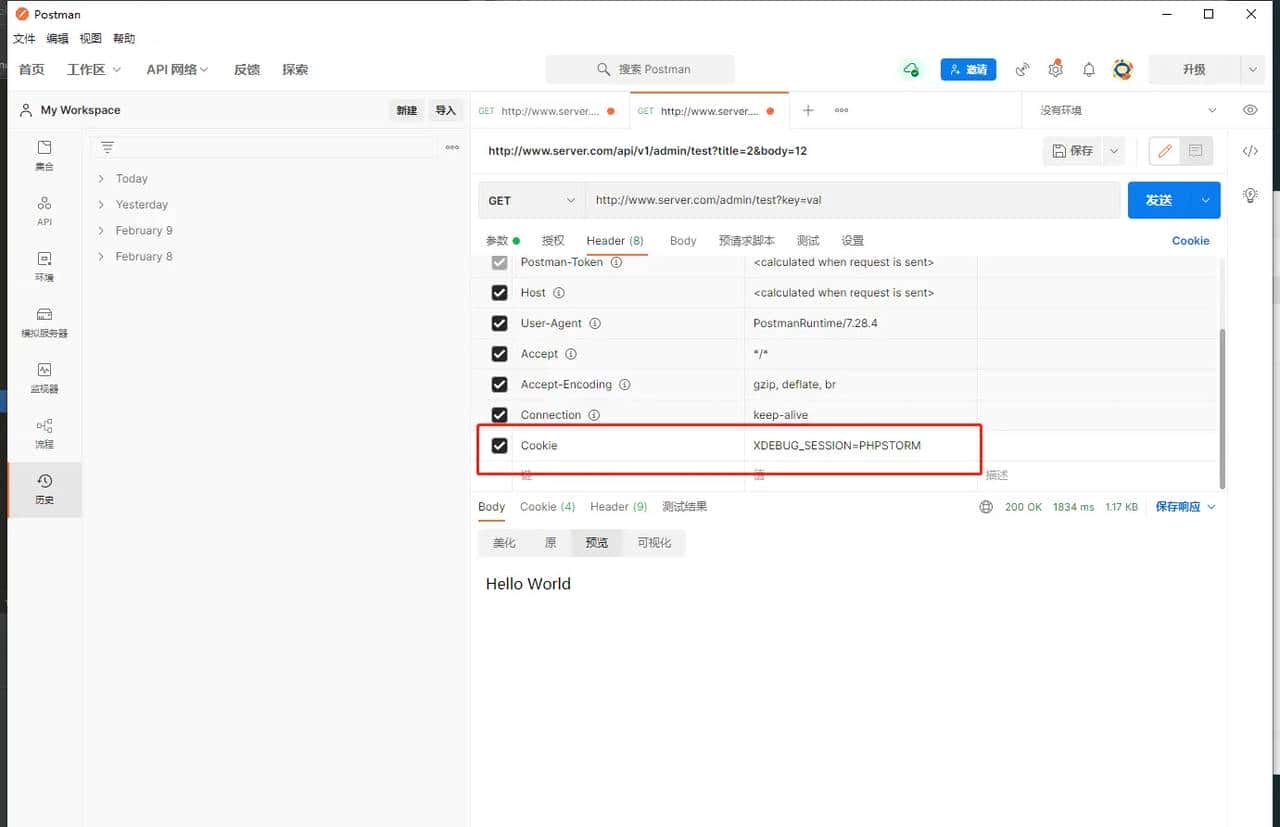
三、Postman 配置
1.Postman 在 Header 中添加 Cookie 的值为 XDEBUG_SESSION=PHPSTORM
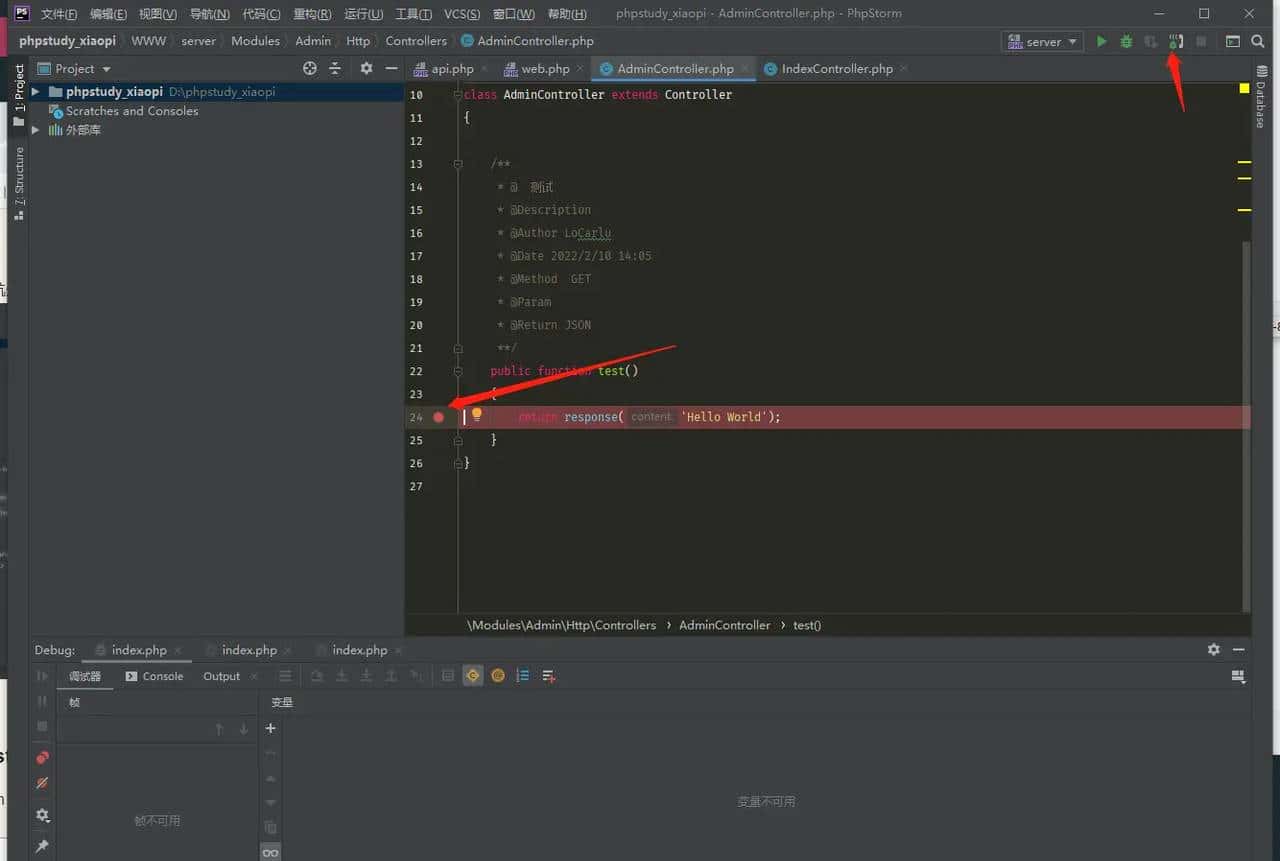
调试
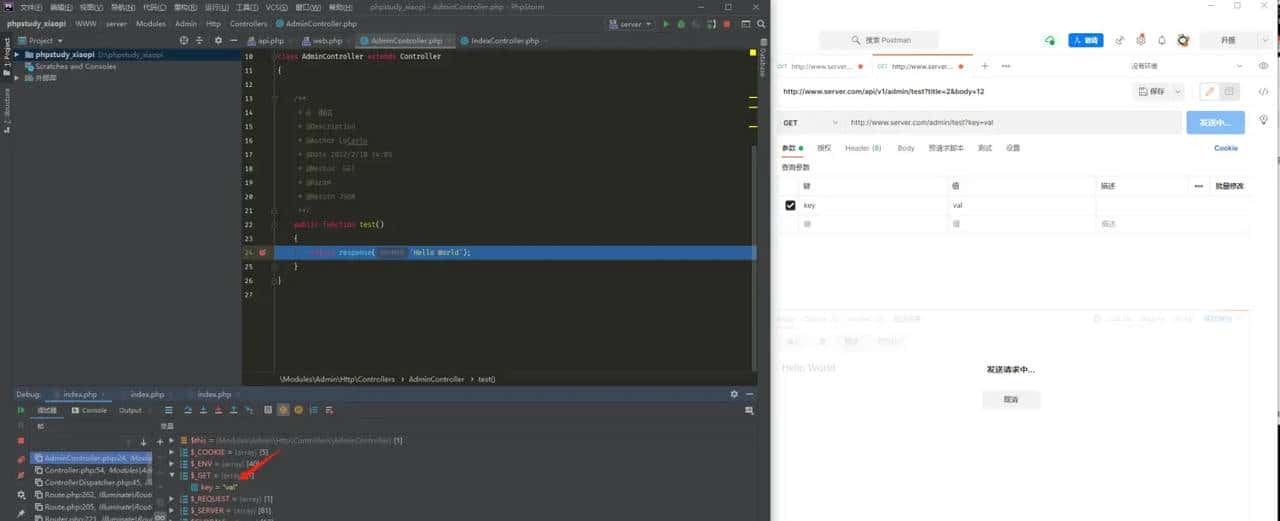
1.Phpstorm 中开启监听,打断点
2.Postman 中发送请求
© 版权声明
文章版权归作者所有,未经允许请勿转载。
相关文章


暂无评论...