
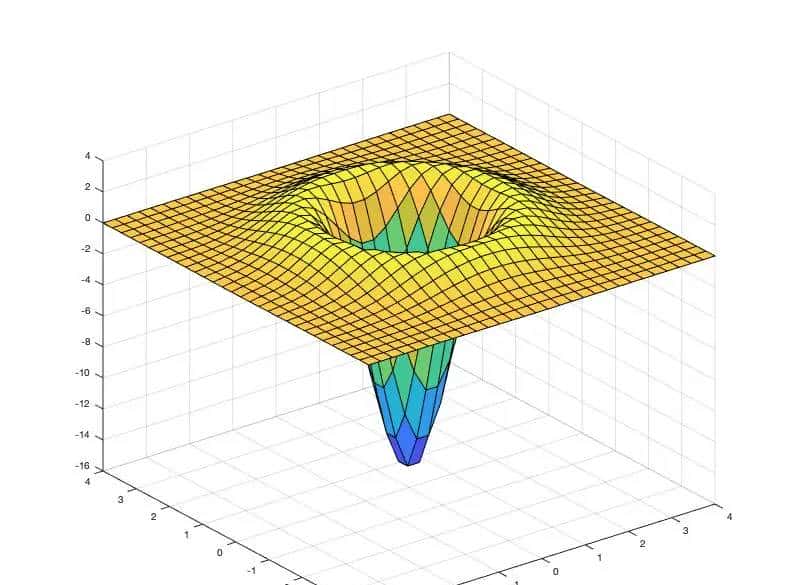
Matlab 上运行:
N = 4;
x=linspace(-N, N,30);
[X,Y]=meshgrid(x,x);
z=del2((1000/sqrt(2*pi).*exp(-(X.^2/2)-(Y.^2/2))));
surf(X,Y,z);
Output:
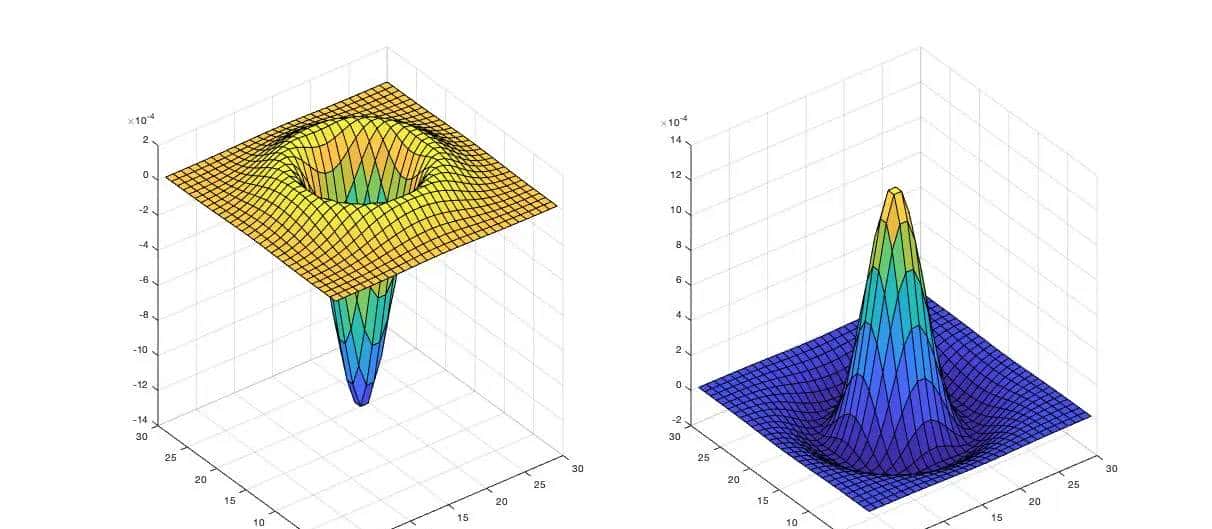
或者:
laplace_gaussian_filter = fspecial( log ,[50 50],5);
subplot(121)
surf(laplace_gaussian_filter);
subplot(122)
surf(-laplace_gaussian_filter);
Output:
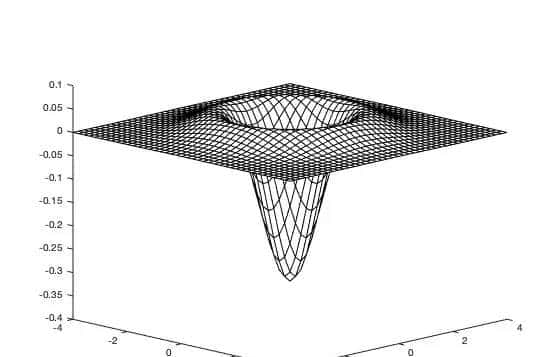
俭朴版:
x = linspace(-4,4,41);
G = exp(-x.^2/2)/sqrt(2*pi);
Gxx = G .* (x.^2-1);
data = G .* Gxx. ;
data = data + data. ;
surf(x,x,data, facecolor , white )
view(45,13)
set(gca, dataaspectratio ,[1,1,0.08])
grid off
xlabel( X )
ylabel( Y )
Output:
参考资料
How to graph/plot 2D Laplacian of Gaussian (LoG) function in MATLAB or python?
LoG算子与DoG算子
© 版权声明
文章版权归作者所有,未经允许请勿转载。
相关文章


暂无评论...


![[理论篇-10]AI 工作流(AI Workflow)—— 让 AI 像流水线一样干活](https://www.dunling.com/img/2.jpg)